ANONYMIZED OPERATING CASE
What customer economics revealed.
A B2B SaaS & payments company
Revenue identified the largest customers. Customer economics revealed where value was created, where it leaked, and which management decisions deserved attention.
This anonymized case draws on operating work that informed the Cost2Serve methodology. It describes findings and management priorities, rather than a separate Cost2Serve client engagement or a claim of realized financial uplift.
Revenue leakage
Value delivered without corresponding revenue captured
Revenue < cost
Some legacy volume produced poor or negative incremental economics
Friction → investment
Recurring support burden pointed to product and self-service priorities
≈ −50%
Modeled segment margin. A high-revenue vertical proved unattractive after included service costs.
Anonymized analysis. No confidential company or customer data shown.
Challenge
Revenue, transaction activity and service demand lived across different systems. Leadership needed a unified view of customer economics.
About the analysis
Contribution represents revenue less costs included in the model. It is a management metric, not GAAP net income or EBITDA. Some costs are allocated using operational proxies. Allocations, assumptions and analytical limitations are documented as part of the engagement.
The analysis connected revenue with transaction processing, support, customer success, implementation and other included delivery costs. Recurring economics were separated from onboarding allocations.
Four findings. Four management decisions.
Assumptions shown as decision lenses, not verbatim management statements.
Anonymized case, not universal benchmarks. Vertical-margin and departure findings are modeled; commercial and service findings reflect operating review. Historical contribution does not establish churn cause or forecast lost profit.
Management assumption
Economic finding
Decision affected
High-revenue vertical = attractive growth opportunity
≈ −50% modeled contribution margin
GTM / marketing focus
These findings inform GTM priorities. Budget allocation also requires acquisition-cost and channel-performance data.
More transaction volume = better economics
Certain legacy transaction prices were below delivery cost
Pricing
Recurring support burden = staffing / service issue
Recurring service demand exposed product and self-service opportunities
Product investment / service model
Churn = revenue / ARR lost
More than 4 in 5 reviewed departures had positive prior-year modeled contribution
Retention prioritization
Revenue alone pointed growth in the wrong direction.
Leadership had viewed one vertical as attractive because of its substantial revenue. Once included service costs were incorporated, its modeled customer contribution margin was approximately −50% in the run-rate scenario.
Management response: The finding materially changed how leadership thought about future Marketing focus and vertical prioritization. Customer economics supplied a stronger economic rationale for future Sales & Marketing attention than revenue concentration alone.
Revenue leakage
Operating work identified consumption not fully reflected in commercial arrangements. Management priority: reconcile activity, entitlements and billing before correcting charges or scope.
Negative transaction economics
Some legacy transaction prices were below delivery cost. More volume could deepen a loss. Management priority: validate unit costs and transaction mix, then test revised pricing and scope.
Product-driven service burden
Operational review connected recurring human intervention with self-service gaps. Management priority: give Product a view of recurring friction and prioritize fixes using recurrence, effort and service quality.
Profitable customer departures
More than four in five reviewed departures had positive prior-year modeled contribution. Management priority: investigate reasons for departure and protect similar retained relationships.
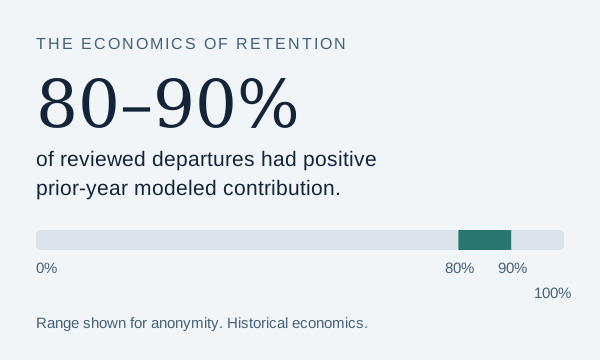
Historical modeled contribution, not forecast lost profit. Reasons for departure require separate investigation.
A high-revenue vertical looked attractive. Customer economics changed the signal.
Management implication: revenue concentration alone was misleading and customer economics informed incremental Sales & Marketing targeting.
Revenue index 100
Included cost index 150
≈ −50% modeled contribution margin
Included costs
Included transaction/delivery, support, implementation, customer success/service costs.
Indexed illustration: revenue = 100.
Traditional view
Revenue/ARR lost
Useful but incomplete.
Customer economics view
- More than 4 in 5 reviewed departures had previously positive modeled contribution.
- Protect similar retained relationships.
- Prioritize retention by economic contribution, investigate departure reasons.
Prior-year modeled contribution is not forecast lost profit. Reasons for departure require separate investigation.
Action
The findings created a fact base for commercial corrections, product priorities and customer investment. Apparent onboarding losses also required validation of actual project effort before action. Each priority needs an owner, validated baseline and measure of realized impact.
Less repeat work can release capacity for valuable customer demand. It does not automatically create cash savings.
What would this reveal about your business?
“We don't start with headcount. We start with customer economics.”